One-line diagram SLD
BESS system Essential term
Reviewed August 2026 by Sergey Syrvachev
A one-line diagram (single-line diagram, or SLD) is the simplified schematic that draws a grid-scale BESS's balanced three-phase power system as a single symbolic conductor, so topology, equipment ratings, and protective devices can be read at a glance.
It traces the canonical chain: battery DC blocks to the power conversion system (PCS), to a medium-voltage step-up transformer, to the collection bus, to the main transformer, through revenue metering, and out to the point of interconnection (POI).
Collapsing three physical phases into one line is a drafting convention, not a loss of information — every device still carries its rating and protective function. At design, protection coordination, commissioning, and interconnection review, it is the first document an engineer, an AHJ, and the interconnecting utility reach for.
New to BESS? Start free in the Learn BESS hub — no cost, no account.
What it is (precise)
An SLD renders a balanced three-phase AC system as one line, drawn in standard IEEE/IEC symbols: sources, breakers, fuses, transformers, disconnects, CTs and PTs, surge arresters, and the grounding scheme. It is not a sketch of where wires go. Each device carries its ratings (kVA/MVA, voltage class, impedance percentage, interrupting kA, fuse and relay settings), its ANSI device number, and its equipment tag. That is what makes it the single source of truth tying physical equipment to protective function.
On large plants it is split across sheets: an overall site one-line, per-block one-lines repeated for each identical PCS-plus-transformer unit, and a separate auxiliary-power one-line for station service. A student first meets it as the drawing every downstream study, permit, and contract points back to.
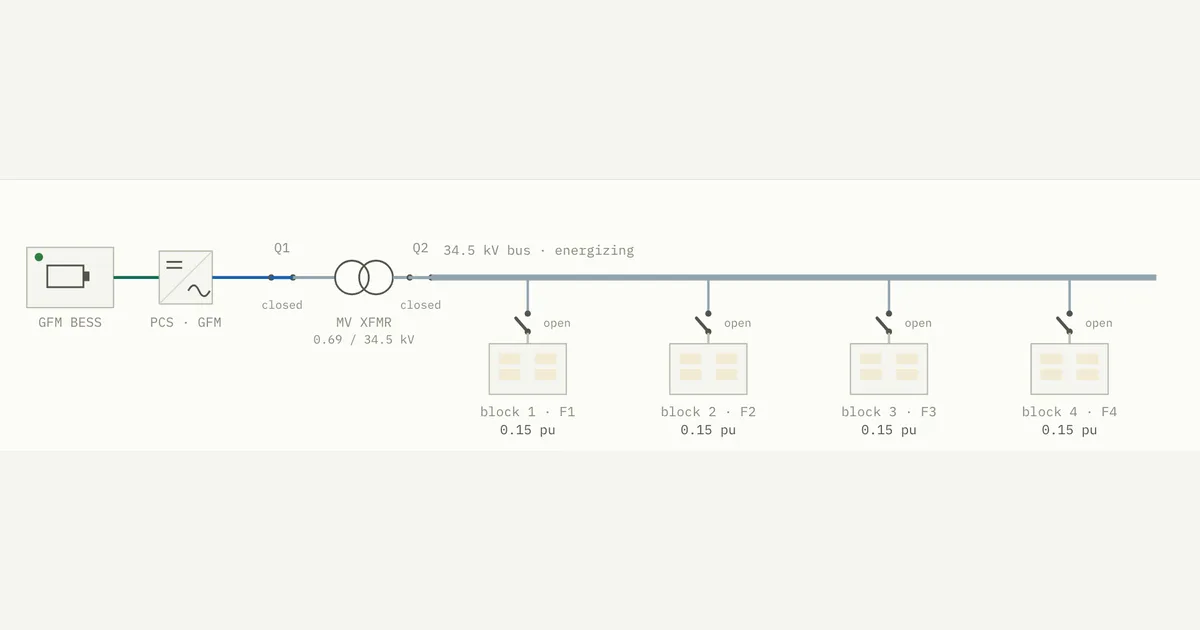 Interactive · bess.engineer ↗
 Reading the chain: DC block to POI
Start at the left of the sheet. Each DC block shows its rack and combiner connections, the DC disconnects and fusing between them, and one labelled bus — in current utility-scale designs a nominal running up to 1500 VDC. The PCS is where the drawing changes units: DC volts and amps on one side, a three-phase AC bus rated in kVA or MVA on the other. Because the PCS moves power both ways, the sheet has to state the sign convention it is drawn under; an arrow on a bidirectional device means nothing until charge and discharge have been given signs.
Each PCS block feeds its own step-up transformer, and two labels on that symbol do most of the work. The rated-voltage quotient — 50 for a 34.5 kV / 690 V unit — is the nameplate ratio, and it equals the per-winding turns ratio only when both windings share a connection type: on a Dyn unit the per-winding figure is 50 x sqrt(3) = 86.6, on a YNd it is 50 / sqrt(3) = 28.9.
The vector group printed beside it tells the protection engineer where the zero-sequence source sits, because a delta winding gives zero-sequence current nowhere to flow while a grounded-wye winding provides a path. Which winding carries the delta varies by market and by design, so read the group rather than assume it.
From there the blocks land on radial MV feeders through the collection switchgear at 13.8-34.5 kV. A feeder's limit is current, not power: at 34.5 kV every 100 A is about 6 MVA (sqrt(3) x 34.5 kV x 0.1 kA), and that same current sets the I2R heating and the voltage drop that make the farthest block on a long feeder the first one to run short of headroom. The collection bus gathers the feeders into the main power transformer, which lifts the plant to POI class, and the last symbols before the utility tie are the metering CTs and PTs and the revenue meter.
That meter is the commercial boundary: it settles energy, and where it does not sit physically at the POI, settlement applies transformer and line loss compensation to move the reading back to the boundary the contract names. The POI is also where the grid code measures capability, so the chain reads in reverse as well — auxiliary load, transformer losses, and cable losses all come out of what the plant can present there, which is why the block-level MVA on the left of the sheet is never the number the interconnection agreement is written against.
Numbers
Key facts
| Diagram standards | Symbols per IEEE 315 / IEC 60617; device function numbers per ANSI/IEEE C37.2 |
|---|---|
| Battery DC bus voltage | Typically ~1,000–1,500 VDC; 2,000 V architectures emerging |
| PCS block size / AC output | Typically ~1–5 MVA blocks at roughly 400–800 V AC |
| Step-up nameplate ratio | 34.5 kV / 690 V quotient = 50 (rated-voltage ratio); equals per-winding turns ratio only when both windings share a connection — Dyn 50 x sqrt(3) = 86.6, YNd 50 / sqrt(3) = 28.9 |
| MV collection voltage | Commonly 13.8–34.5 kV |
| Feeder loading arithmetic | S = sqrt(3) x V_LL x I — at 34.5 kV, every 100 A of feeder current is about 6 MVA |
| POI voltage class | Distribution MV up to transmission 69–345 kV, by plant size |
| Transformer impedance shown | ~6–8% for typical MV units, on the unit's own base (sets fault current and regulation) |
| Revenue metering at the tie | Metering-class CTs/PTs with meters to IEC 62053-22 class 0.2S/0.5S (ANSI C12.20 class 0.2/0.5 in North America); loss compensation applies when the meter is not at the POI |
| Inverter fault contribution | Current-limited ~1.1–1.2x rated typical (grid-following), up to ~1.5x transiently (grid-forming), vs ~5–7x for synchronous machines |
| Auxiliary bus | Typically 400/480 V three-phase from a station-service transformer |
| Interconnection standards | IEEE 1547 (distribution DER, generally ≤10 MVA at PCC); IEEE 2800 (transmission IBR, typically 69 kV and above) |
| Review milestones | Preliminary SLD at interconnection application; ~30/60/90% design reviews; as-built at COD |
| Common device numbers | 50/51 overcurrent, 87 differential, 27/59 voltage, 81 frequency |
| Related safety standards | UL 9540A fire-propagation test; NFPA 855 installation; NFPA 68/69 explosion protection |
Typical values and standards
Voltage classes on a typical SLD: battery DC blocks commonly operate around 1,000–1,500 VDC, though 2,000 V architectures are emerging; PCS AC output is usually low voltage (roughly 400–800 V) from blocks sized around 1–5 MVA, stepped to MV collection at 13.8–34.5 kV; the POI may sit at distribution MV or transmission class (69–345 kV) depending on plant size.
Transformer impedance is shown as a percentage (often ~6–8% for MV units, on the transformer's own base) because it sets both fault current and voltage regulation. The auxiliary system usually appears as a 400/480 V three-phase bus fed from a station-service transformer.
Symbology follows IEEE 315 / IEC 60617, and device function numbers follow ANSI/IEEE C37.2 — for example 50/51 overcurrent, 87 differential, 27/59 under- and overvoltage, 81 frequency. Metering at the tie is drawn to its own accuracy grade: metering-class CTs and PTs feeding a meter to IEC 62053-22 class 0.2S or 0.5S, or ANSI C12.20 class 0.2 or 0.5 in North America, which is a tighter class than the protection cores on the same sheet.
Interconnection requirements depend on where the plant ties in: IEEE 1547 governs distribution-level distributed resources (generally up to 10 MVA at the point of common coupling), while transmission-class BESS, typically at 69 kV and above, falls under IEEE 2800 for inverter-based resources alongside the relevant ISO and utility requirements. The SLD is the drawing those reviews are checked against, revision by revision.
Separately, safety standards such as UL 9540A (the test method that characterizes thermal-runaway fire propagation in a BESS unit; its results feed NFPA 855), NFPA 855 (the US installation standard for stationary energy storage), and NFPA 68/69 (deflagration venting and explosion prevention) govern the enclosure and the site rather than the SLD itself. The SLD is chemistry-agnostic — LFP dominates the stationary blocks it depicts, but cell chemistry changes the fire-protection and spacing context around the equipment, not the electrical topology drawn on the sheet.
In practice
Why it matters in a real grid-scale project
The SLD drives protection coordination and fault analysis. Short-circuit and arc-flash studies, relay setting calculations, and the time-current coordination that ensures the right breaker clears the right fault all derive from the topology and impedances captured here.
An error on the SLD propagates into mis-set relays, uncleared faults, or nuisance trips that strand the asset and erode availability — a direct revenue and warranty consequence. The drawing feeds the model, never the other way around, so a wrong impedance or CT ratio on the sheet corrupts every study built on top of it while the study output still looks entirely plausible.
Commercially, the SLD is a gating deliverable. The interconnecting utility and the AHJ require an approved SLD before energization; it anchors the interconnection agreement, the grid-code compliance demonstration (ride-through, reactive capability, anti-islanding), and the lender's independent-engineering review.
An inverter-based BESS is current-limited: fault contribution is typically ~1.1–1.2x rated current (grid-following), up to ~1.5x transiently for grid-forming, rather than the ~5–7x multiples of synchronous machines. The SLD must therefore make the source character explicit, so protection is designed for the real fault levels instead of utility-style rotating-machine assumptions.
How it shows up in specs, studies and contracts
The SLD follows a project through every stage. The interconnection application requires a preliminary one-line before any study starts; the utility's system-impact and facilities studies are run against it; the design set is reviewed at roughly 30/60/90% completion; the AHJ permit package includes it alongside the NFPA 855 documentation; and energization approval, commissioning test plans, and the as-built handover at COD all reference specific SLD revisions.
EPC contracts commonly name the approved SLD as a controlled document, so a topology change after utility approval can trigger re-study — with schedule and cost consequences measured in months.
Reading one critically is the skill to build.
Check that transformer impedances match the factory test reports feeding the short-circuit model; that every breaker's interrupting rating exceeds the calculated fault duty at its bus; that CT and PT ratios agree with the relay setting files; that the grounding scheme (solidly or resistance-grounded MV collection) is stated rather than implied, with enough zero-sequence data on the sheet to test the effective-grounding criterion of X0/X1 ≤ 3 and R0/X1 ≤ 1, both positive; and that the auxiliary one-line actually covers the full auxiliary load — HVAC, BMS, controls, fire systems — including the backup source that keeps thermal management alive during an outage.
Always ask which revision the protection study used: mismatched revisions are a classic audit finding.
Pitfalls
Common pitfalls
Topology assumptions trip people up. Whether the plant is AC-coupled / DC-coupled changes the diagram fundamentally: a DC-coupled solar-plus-storage plant shares the PCS and shows batteries and PV on a common DC bus, while an AC-coupled plant has separate inverters that meet at an AC bus — twice the conversion equipment on the drawing. On the DC side, the VDC window matters. The bus voltage swings with state of charge, so DC device ratings and PCS operating limits must be checked against the full window, not the single nominal figure printed on the line.
The other recurring failures are documentary. As-built SLDs drift from the studies when field changes are not folded back into the model; engineers who assume synchronous-machine fault levels oversize fault expectations by roughly a factor of five; and transformers and PCS get discussed in MW when they are rated in MVA, which hides the reactive-power margin the interconnection agreement demands. A plant is only as reviewable as its one-line is current — treat revision control on this drawing as seriously as the relay settings derived from it.
Common misconception
A one-line diagram is just a connectivity sketch showing what connects to what.
In reality: An SLD is a rated, standardized engineering document. Every device carries its ratings, equipment tag, and ANSI protective function, and the drawing is the source data for short-circuit, arc-flash, and protection-coordination studies plus utility/AHJ interconnection approval. A connectivity-only drawing cannot support a fault study and will not pass interconnection review — and a stale revision that no longer matches the built plant is just as unusable as no drawing at all.
Go further
Visuals & further reading
- The BESS Single-Line Diagram, Explained: Symbols, Structure, and How to Read One Article
- How Long BESS Project Development Takes: From Site Control to COD Article
- MV collection system Glossary
- MV switchgear Glossary
- Transformer vector group Glossary
- Grounding system Glossary
- Protection relay Glossary
- Point of interconnection Glossary
- POI capability envelope Glossary
- Interactive: BESS Site Component Map Interactive visual · bess.engineer
- Interactive: Energy Station Structure Interactive visual · bess.engineer
One-line diagram, in context.
The Grid-Scale BESS course covers one-line diagram — and the rest of the system — from the ground up, the way it actually gets deployed.