Real power P
Power & energy Essential term
Reviewed October 2026 by Sergey Syrvachev
Real power, denoted P and measured in watts (W — megawatts, MW, at grid scale), is the component of AC power that does net work: the power actually charging or discharging the battery, and the quantity a project is paid to move across the point of interconnection (POI).
It is the in-phase product of voltage and current averaged over a cycle, P = V·I·cos φ, distinct from reactive power (Q, in var) and apparent power (S, in VA), which together form the power triangle S² = P² + Q². Hold P steady over time and it integrates to energy in MWh — the second axis every storage deal is priced on.
Back to the free route: Electrical foundations — no cost, no account.
What it is, precisely
In a sinusoidal AC system, instantaneous power oscillates as voltage and current vary. Real power is the average of that instantaneous product over a full cycle: P = V·I·cos φ per phase, where φ is the phase angle between voltage and current and cos φ is the power factor.
Only the in-phase current component contributes net energy transfer; the quadrature component carries reactive power Q = V·I·sin φ, which flows back and forth without doing net work. For the three-phase systems every utility-scale plant uses, P = √3·V(L-L)·I(L)·cos φ, with harmonics contributing distortion power but essentially no useful P at the fundamental.
For a grid-scale BESS, the power conversion system (PCS) inverters synthesize a current waveform whose in-phase component sets P. A positive convention typically means discharge (export to grid) and negative means charge (import). The reference point matters as much as the number: P at the DC bus, at the PCS AC terminals, at the MV collection bus, and at the POI are four different values separated by AC / DC conversion, transformer, cabling, and auxiliary losses. Integrated over time, real power is energy: 1 MW held for 1 hour is 1 MWh moved through the racks, less round-trip losses.
Why it matters on a real project
Real power is the commercial product of a storage asset — think of P as the tap's flow rate and MWh as the size of the tank. Capacity payments, energy arbitrage, ancillary-service dispatch, and firming obligations are all denominated in MW and MWh of real power delivered or absorbed at the POI.
The MW rating fixes how fast the project charges or discharges; the MWh rating fixes how long. Their ratio — the duration, typically 2 to 4 hours for LFP systems and trending longer — drives both the value the project can capture and the DC block sizing. In C-rate terms, a 4-hour system discharges at 0.25C, gentle enough that cells rarely limit power at moderate temperatures.
Because the PCS is rated in apparent power (MVA), every MVAr of reactive power the grid code or interconnection agreement requires you to supply or absorb (commonly a power factor down to about ±0.95 at the POI) consumes headroom that would otherwise carry real power.
Sizing therefore trades P against Q within the S envelope, and PCS capability curves shrink further with temperature, altitude, and grid voltage. Real power also drives thermal load on cells, buswork, transformers, and HVAC: sustained high-P operation is what the auxiliary cooling, station service, and round-trip-efficiency budget must be engineered around.
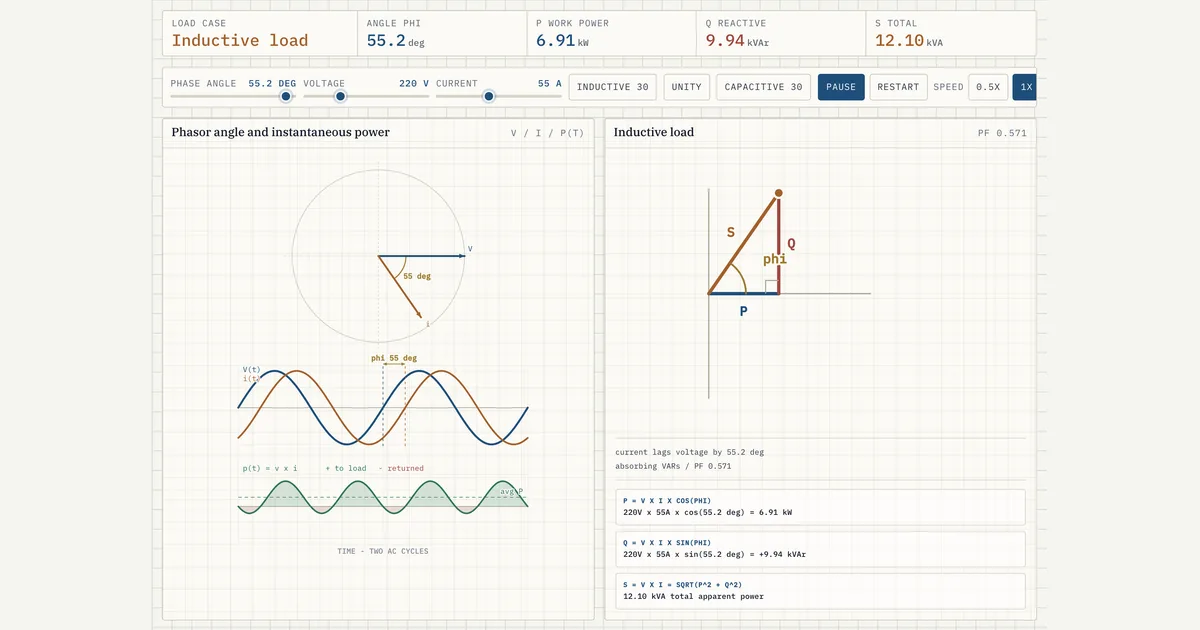 Interactive · bess.engineer ↗
 Key facts
| Symbol / unit | P, in watts (W); grid scale in MW (rate) vs MWh (energy) — never interchange the two |
|---|---|
| Defining relation | P = V·I·cos φ per phase; three-phase P = √3·V(L-L)·I(L)·cos φ |
| Power triangle / real-power bound | S² = P² + Q²; PF = P/S; deliverable P = √(S² − Q²) |
| Duration link | duration = energy ÷ power; 100 MW / 400 MWh = 4 h = 0.25C; 2 h = 0.5C |
| AC-AC round-trip efficiency (LFP) | ~85–90% at POI; PCS ~1.5–3% loss per direction; one-way ≈ √RTE (~95% ↔ ~90%) |
| POI power-factor requirement | commonly down to about ±0.95 — costs MVA headroom that would carry P |
| Typical PCS block size | ~1–5 MVA per inverter block, DC bus up to 1500 V |
| Typical utility-scale project | ~50–500 MW at the POI, 2–4 h duration (trending longer) |
| Frequency-response droop | typically 3–5%: a frequency deviation maps to a real-power correction |
| Revenue metering accuracy | settle to class 0.2S/0.5S (IEC 62053-22) or class 0.2/0.5 (ANSI C12.20) |
| Key interconnection standards | IEEE 2800 (transmission IBR), IEEE 1547 (distribution) |
| Sign convention | positive = discharge/export, negative = charge/import — fix it plant-wide before commissioning |
Typical values and standards
Utility-scale projects today commonly land between roughly 50 and 500 MW at the POI, built from PCS blocks of about 1–5 MVA each on DC buses up to 1500 V. Round-trip efficiency is the dominant real-power loss metric: AC-to-AC RTE for modern LFP systems is typically on the order of 85–90% at the POI, after PCS conversion losses (each direction commonly 1.5–3% at rated load), transformer and auxiliary loads, and cell internal resistance.
NMC offers comparable RTE but is far less common in stationary storage on safety and cost grounds, so LFP is the default assumption. Note that one-way efficiency is roughly the square root of RTE — about 95% one-way corresponds to about 90% round trip.
Real power is metered and settled under utility revenue-metering accuracy classes (commonly class 0.2S/0.5S under IEC 62053-22, or class 0.2/0.5 under ANSI C12.20). Interconnection performance against a real-power setpoint is governed by IEEE 2800 for transmission-connected inverter-based resources and IEEE 1547 for distribution interconnections, plus regional rules from NERC, ENTSO-E, or AEMO.
Frequency-response obligations translate frequency deviation into a real-power correction through a droop setting, typically 3–5%. Safety standards like UL 9540 (the ESS product safety certification), UL 9540A (the separate fire-propagation test method feeding NFPA 855), and NFPA 855 itself constrain layout and thermal design but do not rate real power; that comes from PCS and battery datasheets and the interconnection limit.
How it shows up in specs, studies and contracts
On a PCS or battery datasheet, treat every MW figure as conditional: read the reference ambient temperature, altitude, grid voltage, power factor, and — critically — the measurement point. A PCS rated 3.6 MVA at 35 °C may deliver noticeably less at 50 °C, and a plant quoted in nameplate MW at the inverter terminals shows a smaller net number at the POI once transformer and auxiliary losses are netted off.
The same three-way split governs energy: nameplate MWh, usable energy inside the operating SOC window, and contracted MWh at the POI are distinct quantities — and the commissioning capacity-test report proves delivered MWh while discharging at rated P.
In the interconnection study, real power appears as injection and absorption profiles the transmission provider models for thermal and stability limits — storage is studied in both directions, unlike generation. Market rules denominate offers, dispatch instructions, and non-performance penalties in MW; in the US, FERC Order 841 obliges wholesale markets to accommodate bidirectional storage dispatch.
Warranties commonly cap annual energy throughput (MWh) and maximum C-rate, which are real-power limits wearing energy clothing. So on any document, ask the same five questions: at which bus is this MW defined, at what temperature and power factor, at beginning or end of life, and does it include auxiliary consumption?
Common pitfalls
The most frequent error is reference-point drift: mixing DC-side, AC-terminal, and POI-net MW figures inside one calculation, or quoting beginning-of-life capability where the contract requires end-of-life performance.
Auxiliary supply arrangement matters too — if HVAC and controls are fed from the plant's own MV bus, every MWh they consume reduces net delivered energy and measured RTE; if they are fed from a separate utility service, they show up as an operating cost instead. Sign conventions can differ between the BMS, PCS, and SCADA layers, so a plant-wide convention (positive = export) must be nailed down early.
Power capability is also not flat across state of charge: discharge power derates near empty and charge power near full, so a 100 MW rating usually holds only across a middle SOC band at moderate temperatures. And the perennial units trap: MW is a rate, MWh is a quantity — a 100 MW / 400 MWh plant is a 4-hour system, and confusing the two invalidates every downstream revenue and sizing number. EV fast-charging marketing, where peak kW headlines dominate, is a poor mental model for stationary assets that earn on sustained, repeatable MWh throughput.
Common misconception
A BESS rated at 100 MVA can deliver 100 MW of real power under all conditions.
In reality: The 100 MVA is apparent power (S). Real power is bounded by P = √(S² − Q²), so any reactive-power obligation — e.g. holding 0.95 power factor at the POI — reduces the deliverable real power. At PF 0.95, roughly 31 MVAr of reactive output leaves about 95 MW of real power within a 100 MVA envelope, and that is before any further derating for temperature, voltage, and state of charge.
Visuals & further reading
- Interactive: Phase Shift and Power Interactive visual · bess.engineer
- Interactive: Power Factor Triangle Interactive visual · bess.engineer
- Interactive: PCS Dispatch Efficiency Interactive visual · bess.engineer
Real power, in context.
The Grid-Scale BESS course covers real power — and the rest of the system — from the ground up, the way it actually gets deployed.